


Past edition
NOI Hackathon Open Data Hub Edition
May 20th - 21st, 2022
Schedule
- Day 1 Friday 20th May
- 14.00 Check-in
- 14.30 Opening and participants pitches
- 15.30 Kick-off: time starts!
- 15.35 Prize criteria presentation + Q&A session
- Hacking time
- 18.30 First project presentation round
- Nighttime hacking
- Day 2 Saturday 21st May
- 9.00 Second presentation round
- Hacking time
- 15.15 Approaching Time Ends
- 15.30 Time ends
- 15.35 Project presentation time
- 16.30 Jury retires to vote
- 17.00 Winner proclamation
Partners & Supporters
NOI Hackathon Open Data Hub Edition is supported by
Projects


Prizes
-

Crowdsourced Data Sharing challenge
Won by air4me
Offered by Open Data Hub
Read moreYou and your team will receive a 1.000 € monni Card (total amout for the team)
Show criteriaThe Open Data Hub is a vast pool of different datasets from various data providers. Each dataset has dedicated data collectors, tailored to retrieve and receive data from the according data provider.
To open up the Open Data Hub for crowd sourced data, there is an MQTT broker, allowing data to be sent to the Open Data Hub and to be stored in a raw data table. This data can be processed in future steps.
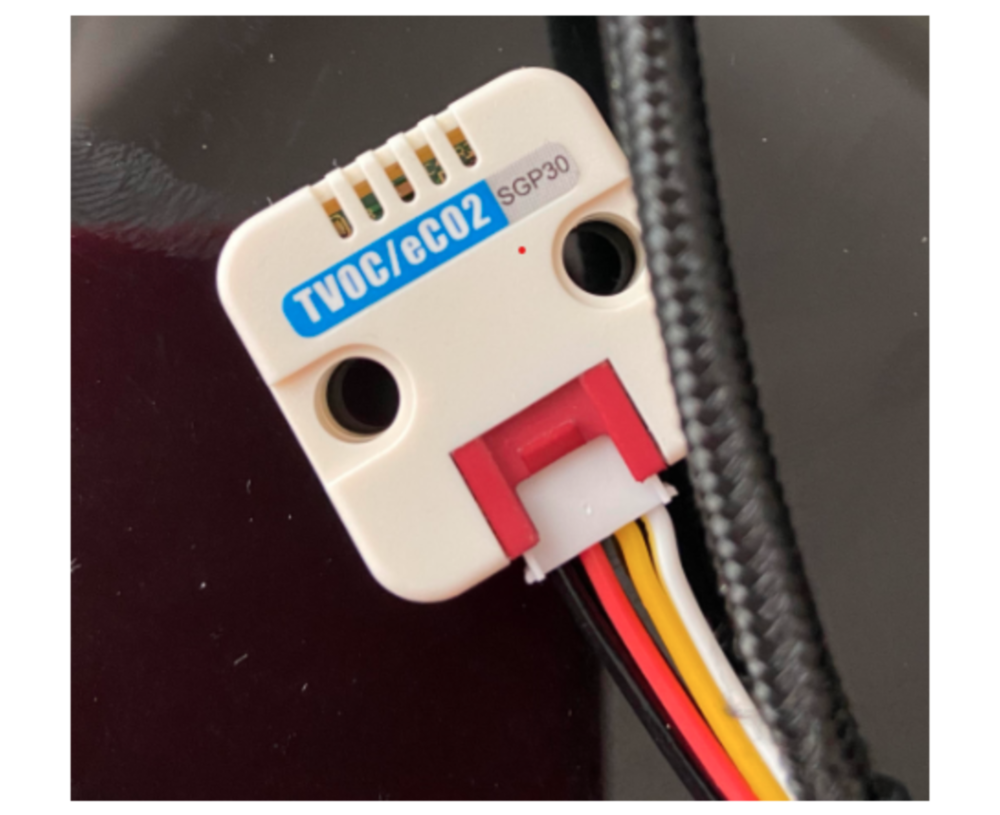
The challenge consists in setting up components, such as software scripts, sensors, devices or other senders, collecting qualitative data to be sent to the MQTT broker of the Open Data Hub. The idea is to have a working showcase which could easily be scaled up to a large number senders. Those senders can be hardware sensors or software scripts. It is crucial that collected data can be shared without copyright violations. -

Data Visualization Templating Designer challenge
Offered by Open Data Hub
Read moreYou and your team will receive a 1.000 € monni Card (total amout for the team)
Show criteriaIn these modern days it is a good habit to work on a single design from remote places.
This makes it necessary to have powerful editors that allow to bring your desktop workflow into the browser. We, at NOI Techpark, have e-paper displays as sign-posts for events and room information. The central configuration tool for all such displays is a web application with a templating engine running, which gets filled by the Open Data Hub APIs. For that web tool, we need a what-you-see-is-what-you-get templating editor as web component with cool features, like:
- drag-and-drop functionality
- text editing with various font-faces, sizes and colors
- insertion and manipulation of images
- inversion of colors
- helper lines for positioning
- saving and loading of templates
- live preview
- ... and every cool thing you can think of! -
Events Data Visualization challenge
Won by PowerEvents
Offered by Open Data Hub
Read moreYou and your team will receive a 1.000 € monni Card (total amout for the team)
Show criteria
The Open Data Hub offers datasets containing description and geo-location data on events. Different institutions use the Open Data Hub to insert their daily events and venues.
The challenge consists in creating a component visualizing those events on big or small screens. Those screens visualizing the next events of a specific venue or conference room can be placed at each venue or in a main entrance hall. All screen devices have a browser and can load the visualization remotely by inserting an URL with parameters.In particular the visualization should take into consideration some configurations like:
- showing one or more events for a specific venue
- showing events in one or more days
- showing all or more events in an overview
- uploading one or more logos to be shown
- uploading one or more media files, such as pictures and videos, for a slideshow (can be a cloud storage)
- having a fallback visualization if there are no events or data connection is lost -
Time Series Sensor Data Visualization challenge
Won by Orange Juice
Offered by Open Data Hub
Read moreYou and your team will receive a 1.000 € monni Card (total amout for the team)
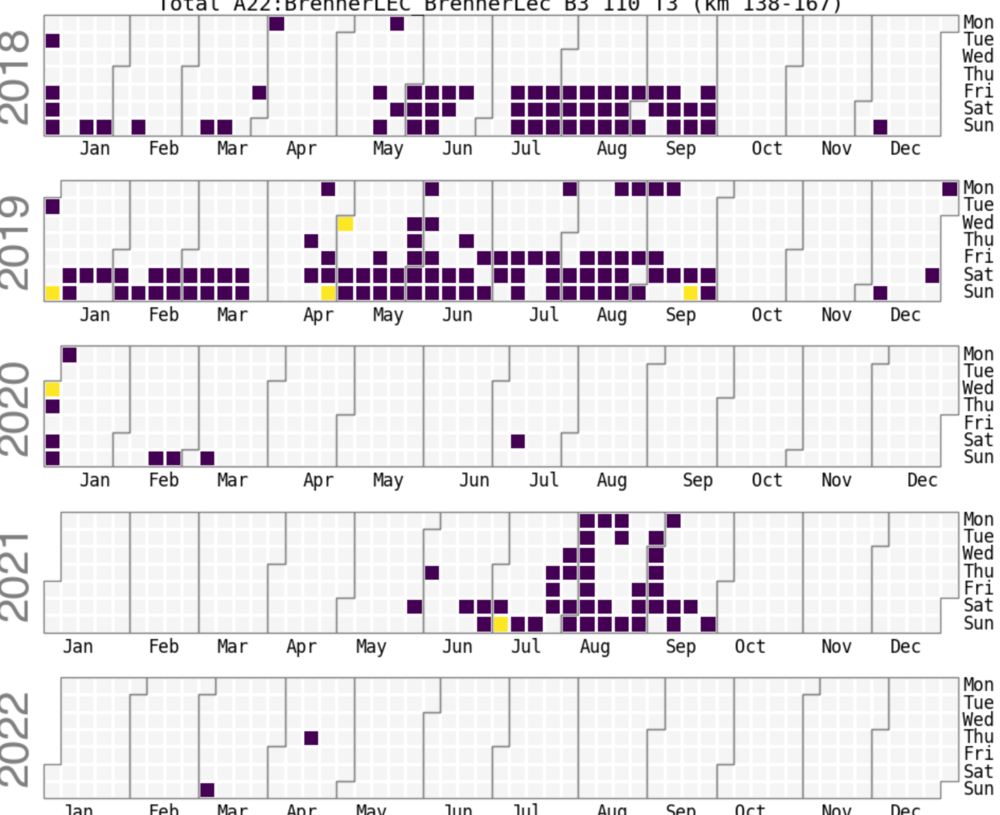
Show criteriaThe Open Data Hub contains several time series of various domains. The visualization of such data is challenging, because it has so many dimensions, like time lines, coordinates on a map, descriptive data, and much more. The exploration of such data needs a powerful tool, that allows visualization, comparisons, statistical evaluation, zooming, aggregation and drilling down on several levels of data.
Design and implement a web component based visualization tool, that allows just with the Open Data Hub API to explore the vast amount of time series data from their top automatically, and a drill down into data series. In addition, easy selection and deselection of data points, and various elaboration options from different visualization types to statistical methods.
The drill down should follow a hierarchy, as for example:
- station types, ex. weather
- data types, ex. temperature
- measurement points
- time series measurements
It is important that to show data, we do not need manual configuration, just the utilization of the tool. All hierarchies and metadata should be taken directly from the APIs.
From UI/UX perspective, the web component should focus on easy comparison of one or more time-series.
The rest belongs to your imagination!